



Chat with us, powered by LiveChat

Credit Card Fraud Statistics 2026: What the Primary Sources Say

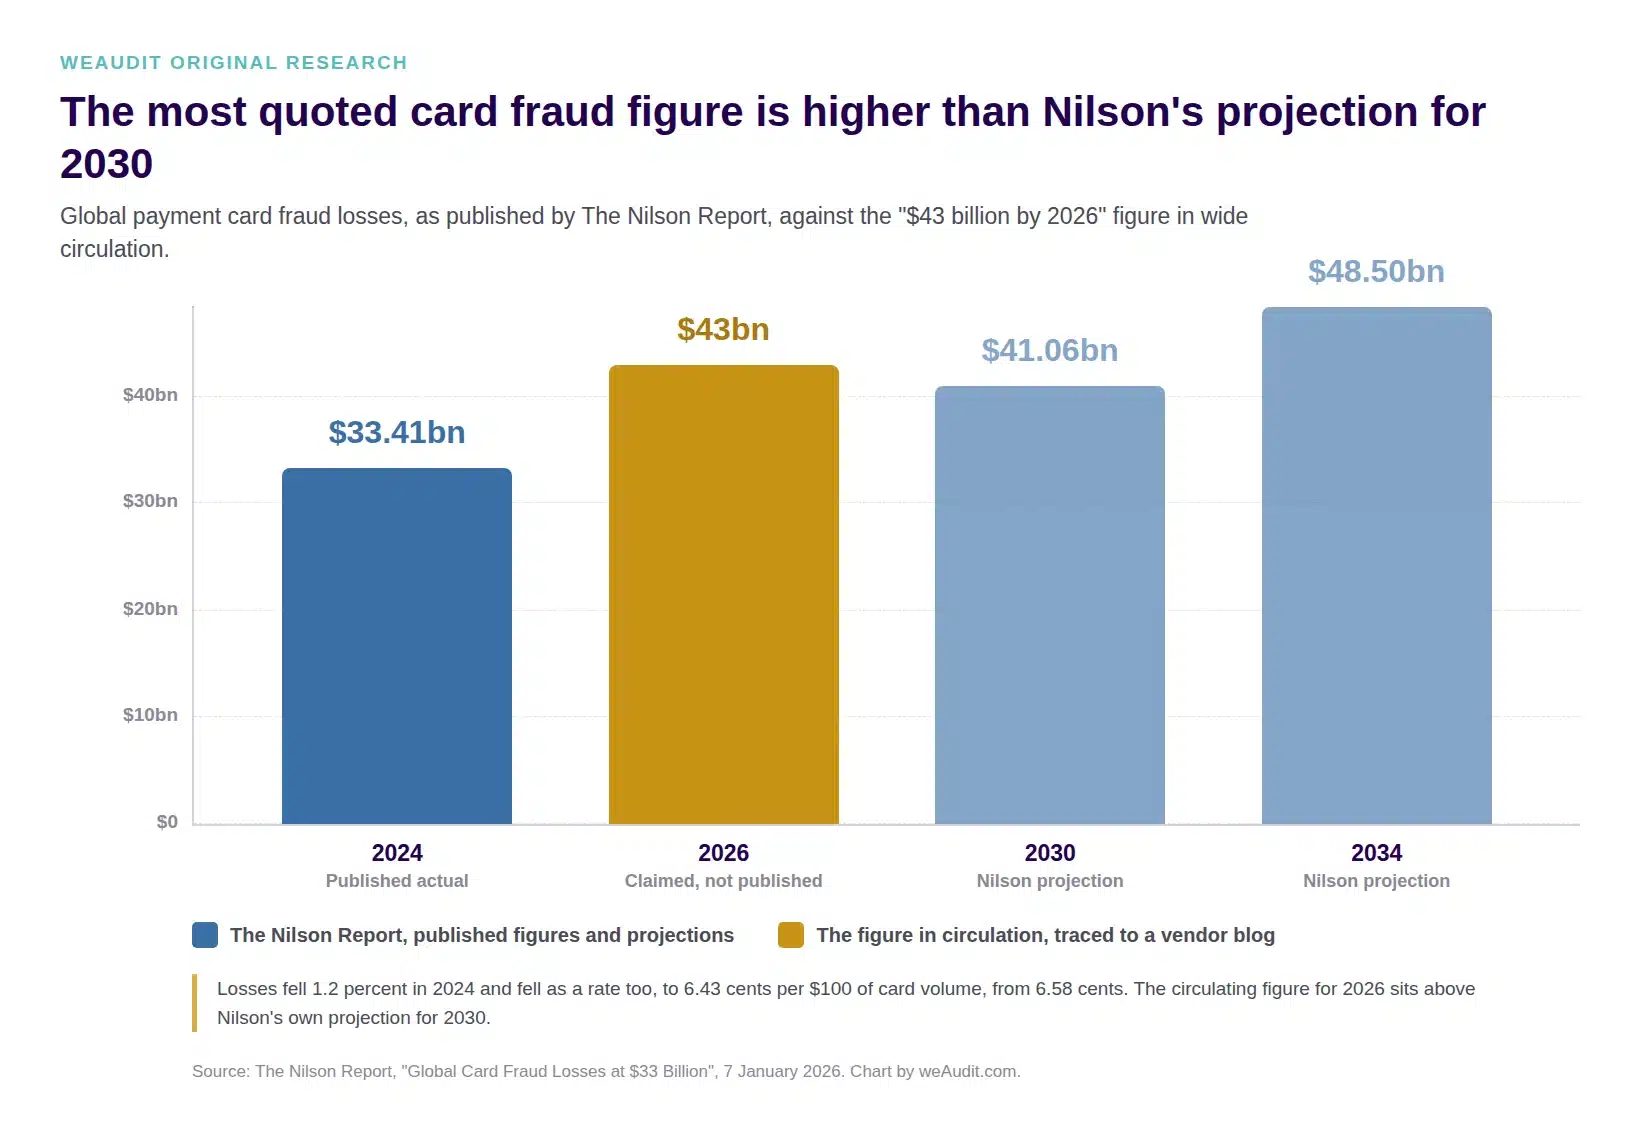
Bar chart comparing global card fraud losses: $33.41 billion published by the Nilson Report for 2024, the circulating $43 billion claim for 2026, and Nilson projections of $41.06 billion for 2030 and $48.50 billion for 2034.

Original weAudit research

Most published credit card fraud statistics trace back to one number: that losses will reach $43 billion worldwide by 2026. It appears on payment processor blogs, security vendor sites, national personal finance titles and at least two academic journals. The Nilson Report, which is the source everyone is reaching for, published something different: global card fraud losses fell 1.2 percent to $33.41 billion in 2024, and are not projected to pass $41 billion until 2030.

The credit card fraud statistics on this page are each carried back to the organisation that published them, with the year they describe and a link to the document. It is written for the business that accepts the cards rather than the consumer who carries them, because that is where the numbers get used to sell something. Most credit card fraud statistics published online are compiled for cardholders, and a merchant reading them is being handed the wrong half of the picture.

The figures, in brief

$33.41 billion  in global payment card fraud losses in 2024, down 1.2 percent on the year. Nilson Report, January 2026.

6.43 cents  lost to fraud per $100 of card volume in 2024, down from 6.58 cents the year before. Fraud is falling as a rate, not rising.

26.31% of volume, 41.87% of losses  the United States share of global card spend, against its share of global card fraud. Americans carry a fraud burden well over their weight.

14.2 basis points  the card present fraud rate on dual message networks in 2023, against 5.1 on single message networks. Card present fraud is flat to falling. Card not present is where the growth is.

150 basis points  the Visa VAMP ratio at which a US merchant is now Excessive, down from 220 on 1 April 2026. The bar for being flagged moved, and it only counts card not present activity.

449,032  credit card identity theft reports to the FTC in 2024, the single largest identity theft category. 406,110 of them were new accounts opened in someone else’s name.

$12,537,194,708  in total reported US fraud losses across all categories in 2024, from 2,600,678 reports. Only 38 percent of reports involved money actually lost. This is not a card fraud figure, though it is constantly quoted as one.

$41.06 billion by 2030  Nilson’s actual forward projection, on global card volume of $70.731 trillion. Not 2026.

The $43 billion problem

Search for how much card fraud costs and one number comes back again and again: $43 billion worldwide by 2026. It is quoted by a global payment processor, by two of the largest infrastructure and security companies on the internet, by a national personal finance magazine, by fintech trade press, and by at least two peer reviewed academic publishers.

Follow it back and it does not lead to the Nilson Report. It leads to a consulting firm’s statistics page, which sourced it to a chargeback vendor’s blog, which was working from a Nilson projection published years earlier and since revised.

  The figure in circulation What Nilson actually published
Global losses $43 billion by 2026 $33.41 billion in 2024
Direction Rising sharply Down 1.2 percent on the year
Rate of loss Not stated 6.43 cents per $100, down from 6.58
When $41bn is reached Implied now Projected 2030

Source: The Nilson Report, “Global Card Fraud Losses at $33 Billion”, 7 January 2026.

The circulating figure overstates card fraud by roughly 29 percent, and gets the direction of travel backwards. Fraud losses did not rise in 2024. They fell, and they fell as a share of volume too.

Bar chart comparing global card fraud losses: $33.41 billion published by the Nilson Report for 2024, the circulating $43 billion claim for 2026, and Nilson projections of $41.06 billion for 2030 and $48.50 billion for 2034.
The circulating figure for 2026 is larger than the Nilson Report’s own projection for 2030. Figures as published by The Nilson Report, 7 January 2026.

This is not a small thing. Merchants are sold fraud tools, monitoring services and automatic enrolments on the strength of numbers like these. A statistic that inflates the threat by nearly a third, and hides the fact that the industry is winning on this measure, is worth more to whoever is selling the tool than it is to the business buying it.

Credit card fraud statistics: what the primary sources actually say

Global losses: the Nilson Report

Nilson is the reference source for global card fraud, and has been for decades. Its January 2026 release puts worldwide payment card fraud losses at $33.41 billion for 2024, against global card volume of $51.920 trillion. Losses fell 1.2 percent on the year, and the loss rate fell from 6.58 to 6.43 cents per $100 of volume.

Its forward projections are $41.06 billion by 2030 on volume of $70.731 trillion, and $48.50 billion by 2034 on volume of $84.755 trillion. Losses grow in absolute terms because card volume grows. As a rate they do not.

The United States pays more than its share

The most useful figure in the whole release is one almost nobody quotes. The United States accounted for 26.31 percent of global credit, debit and prepaid card volume in 2024, but 41.87 percent of global losses to fraud.

A quarter of the world’s card spending carries over four tenths of the world’s card fraud. American merchants are not imagining that they face more of this than their counterparts elsewhere. They demonstrably do.

US consumer reports: the FTC

The Federal Trade Commission’s Consumer Sentinel Network Data Book 2024, published 28 February 2025, recorded 1,135,291 identity theft reports. Credit card fraud was the largest single category at 449,032 reports, of which 406,110 involved a new account opened in the victim’s name and 52,428 involved an existing account.

Across all fraud categories the FTC logged 2,600,678 reports and $12,537,194,708 in losses. Note what that figure is and is not: it is total reported losses across every kind of fraud, not card fraud, and it is what consumers reported rather than an estimate of what actually occurred. It is frequently repeated as a card fraud number. It is not one.

Where the fraud happens: the Federal Reserve

The Federal Reserve Bank of Kansas City published new card present and card not present fraud rates on 25 February 2026, drawn from the Board of Governors’ biennial debit card reports. In 2023 the card present fraud rate was 14.2 basis points on dual message networks and 5.1 basis points on single message networks.

Between 2021 and 2023 the card present rate fell by 0.7 basis points on dual message networks while rising 1.4 on single message. Card not present rates rose, and for the first time the single message card not present rate passed the dual message rate. The chip migration moved fraud rather than removing it, and it moved it to where the merchant carries more of the risk.

Card not present fraud is where the exposure moved

Almost every set of credit card fraud statistics published for a general audience treats fraud as one thing. For a business that accepts cards it is two things, they behave differently, and only one of them is growing.

What card not present fraud is

Card not present fraud, often shortened to CNP fraud, is fraud on a transaction where the physical card was never presented to a terminal. Online checkouts, payments taken over the phone, mail order, recurring billing and invoices paid by emailed link are all card not present. The card number is used without the card, and without the cardholder.

The distinction is not academic. It sets what you pay in interchange, it sets who absorbs the loss when a transaction turns out to be fraudulent, and it sets which monitoring programs you are measured against. A restaurant and a distributor billing the same monthly volume are in two different risk businesses.

What the Federal Reserve data shows

The Kansas City Fed briefing is the only recent US source that separates the two cleanly, and it is drawn from the Board of Governors’ biennial debit card reports rather than from any vendor’s own book of business. Two findings matter to a merchant.

First, card present fraud is no longer the problem it was. Between 2021 and 2023 the card present rate fell 0.7 basis points on dual message networks. Second, card not present rates rose over the same period, and single message card not present fraud passed dual message card not present fraud for the first time.

Read those together and the shape of the problem is clear. The fraud did not go away when the terminals changed. It went to the checkout page, where there is no chip to read and no cardholder standing in front of anyone.

Why the chip migration moved fraud instead of removing it

A chip card is very hard to counterfeit and the card number printed on it is not. Once counterfeiting a card at a terminal became difficult, the same stolen numbers kept their value in every channel where nobody checks a chip. That is the whole mechanism, and it explains why the headline total can fall while a particular merchant’s experience gets worse. The aggregate is falling. The share of it aimed at card not present merchants is not.

Who actually pays for card fraud

Consumer facing coverage of credit card fraud statistics almost always answers this question from the cardholder’s side, where the answer is reassuring. Federal law and network rules mean a consumer disputing a fraudulent charge is rarely out of pocket. The money still comes from somewhere.

The liability shift, in plain terms

Under the card networks’ published liability shift rules, the party that did the least to prevent the fraud carries it. In a card present sale, a merchant who reads the chip has generally moved counterfeit liability to the card issuer. A merchant who swiped the stripe on a chip card has generally kept it.

In a card not present sale there is no chip to read, so the default position is different. The merchant is normally the party that absorbs a fraudulent card not present transaction through a chargeback, subject to the authentication tools they did or did not use. This is the single most important thing an ecommerce or phone order merchant can understand about their own exposure, and it is the thing consumer statistics pages have no reason to mention.

What a fraudulent sale actually costs a merchant

The loss is not the transaction amount. On a fraudulent card not present order that turns into a chargeback, a merchant can lose the goods, lose the sale amount, and still pay a chargeback fee on top of it.

That fee is worth understanding, because it is not a network cost. Chargeback fees are set in your processing agreement, not in the Visa or Mastercard schedules, which makes them a priced item like any other line on the statement. Two merchants with identical dispute volumes can pay very different amounts for the same event, and neither one will find out from the fee’s name.

The threshold most merchants have never heard of

Fraud statistics matter to a business mainly through one mechanism: the ratio the card networks measure you on. Cross it and the consequences are real, including fees passed down through your acquirer and, at the far end, difficulty keeping an account at all.

How the VAMP ratio is calculated

Visa’s Acquirer Monitoring Program, VAMP, replaced the older separate fraud and dispute programs. Its ratio, as Visa publishes it, is the count of fraud reports and disputes divided by the count of settled transactions, measured on card not present activity.

VAMP ratio = count of fraud (TC40) + disputes (TC15) ÷ count of settled transactions (TC05)

Two features of that formula catch merchants out. It counts events, not dollars, so a business with many small transactions is measured on the same footing as one with few large ones. And it combines fraud with ordinary disputes, so a run of delivery or billing complaints moves the same number that fraud does.

What changed on 1 April 2026

Visa’s published thresholds put a merchant in the United States, Canada, Europe and Asia Pacific in the Excessive band at a VAMP ratio of 220 basis points or higher, subject to a minimum monthly count of 1,500 fraud and dispute events. On 1 April 2026 that merchant threshold dropped to 150 basis points. At the acquirer level the bands are 50 basis points for Above Standard and 70 for Excessive.

Source: Visa Acquirer Monitoring Program fact sheet, Visa Inc.

A merchant sitting comfortably inside the old threshold could be outside the new one without a single thing changing in their business. That is a more useful fact than any headline loss total, and it appeared on none of the widely quoted credit card fraud statistics pages we reviewed.

How credit card fraud affects a business that is never defrauded

There is a second way fraud costs merchants money, and it does not require any fraud to occur. It is the cost of the products sold against it, and it is the reason credit card fraud statistics are worth getting right in the first place.

Fraud products appear on statements whether or not you asked for them

Automatic enrolments and free trials that convert to billed services are a recurring finding in our audit work. Credit card processing is a non-regulated industry, and nothing obliges anyone to make a new line item obvious to you. A fraud or security product added at the account level appears as a name on a statement, and statement names are chosen by the party doing the billing.

This is where an inflated headline number does its real work. A merchant who believes fraud is exploding does not question a new monitoring charge. A merchant who knows the loss rate fell to 6.43 cents per $100 asks what the charge is for and what it replaced.

What is worth having, and what is sold on a bad number

We are not a fraud prevention vendor and we do not sell any of these tools, so treat this as an auditor’s view rather than a recommendation. Card not present merchants generally do need address and security code verification, and generally do benefit from the authentication programs that shift liability back to the issuer. Those are worth what they cost.

What deserves a question is anything billed monthly at the account level, priced per transaction on top of a service you already have, or enrolled without a signature. Ask which of your actual transactions it touches, ask what happens to your VAMP ratio without it, and ask for the effect in numbers from your own account rather than from an industry statistic.

What this means if you accept cards

Check the number before you buy the product. Fraud tooling is often sold against a headline figure. If the figure is a third too high and moving the wrong way, the case for the spend deserves a second look. Ask which primary source it comes from and what year it describes.

Card not present is where your exposure actually is. The Fed’s data is unambiguous on this. If your risk controls and your spending are still weighted toward the terminal rather than the checkout, they are aimed at the part of the problem that is shrinking.

Know your own ratio before someone else tells you it is a problem. The VAMP calculation is simple arithmetic on data you already have. A merchant who can state their own number is a much harder sell for anything priced against fear.

Read the statement, not the summary. Fraud and security products are billed at the account level and named by the biller. Our statement decoder covers what the individual line items mean, and the same logic applies to anything with the word protection or security in its name.

Our sourcing rule

Every one of the credit card fraud statistics on this page comes from a primary publisher, is linked to the document it came from, and carries the year it describes. Where a number is a projection we say so and give the projection year. Where a figure measures reports rather than losses, or all fraud rather than card fraud, we say that too, because those are the three places this subject goes wrong most often.

We do not cite aggregator pages, vendor blogs or other statistics round-ups, because a figure that has passed through two intermediaries has usually lost its year, its basis, or both. That is how a 2019 projection became a 2026 fact, and it is why so many credit card fraud statistics agree with each other while all being wrong together.

The same method produced our interchange category study, which counted the Visa and Mastercard rate schedules directly rather than repeating a published total, and our explanation of the BANKCARD MTOT DISC charge, written from real statements rather than from other people’s blog posts.

This page is reviewed twice a year, in April and October, alongside the network rate releases. If you find an error in it, tell us and we will correct it in public.

Citing this research

These credit card fraud statistics are free to quote and republish with attribution. If you have previously published the $43 billion figure, the correction above is free to use and needs no credit to us at all.

weAudit.com, “Credit Card Fraud Statistics 2026: What the Primary Sources Say.” Compiled from The Nilson Report (January 2026), the FTC Consumer Sentinel Network Data Book 2024, Federal Reserve Bank of Kansas City payments research (February 2026), and the Visa Acquirer Monitoring Program fact sheet.

Published 2 September 2026. Next scheduled review: October 2026.

Frequently asked questions

How much does credit card fraud cost worldwide?

$33.41 billion in 2024, the most recent year measured, according to the Nilson Report. That was a fall of 1.2 percent on the previous year. The widely repeated figure of $43 billion by 2026 is not supported by Nilson’s published data.

Is credit card fraud getting worse?

Not as a rate. Losses per $100 of card volume fell from 6.58 cents to 6.43 cents in 2024. Absolute losses grow over time mainly because card volume grows. The composition is changing though: card present fraud is flat to falling while card not present fraud is rising.

How common is credit card fraud?

Common enough to be the largest single identity theft category in the United States, at 449,032 FTC reports in 2024, and rare enough as a share of spending that only 6.43 cents of every $100 put on a card is lost to it. Both statements are true, and which one gets quoted usually depends on what the person quoting it is selling.

What is card not present fraud?

Card not present fraud, or CNP fraud, is fraud on a transaction where the physical card was never presented to a terminal: online, over the phone, by mail order, or through recurring and invoiced billing. It is the category the Federal Reserve data shows growing, and the category where the merchant rather than the issuer normally absorbs the loss.

Who pays for credit card fraud, the merchant or the bank?

It depends on the channel. In a card present sale where the chip was read, counterfeit liability generally sits with the card issuer. In a card not present sale the merchant normally absorbs it through a chargeback, subject to which authentication tools were used. The cardholder is rarely the one out of pocket in either case.

What is the most common type of identity theft?

Credit card fraud, at 449,032 of the 1,135,291 identity theft reports the FTC received in 2024. The great majority, 406,110, were new accounts opened in someone else’s name rather than misuse of an existing card.

How does credit card fraud affect a business?

Three ways, in rising order of cost. The direct loss on a fraudulent sale. The chargeback fee that comes with it, which is set in your processing agreement rather than by the card networks. And the monitoring thresholds, where a high enough ratio of fraud and disputes brings fees and, at the extreme, trouble keeping the account.

What is a normal chargeback rate?

There is no published industry average worth quoting, and any single figure would hide enormous variation by sector. The number that actually governs you is Visa’s threshold. From 1 April 2026 a US merchant is in the Excessive band at a VAMP ratio of 150 basis points or higher, down from 220, measured as fraud plus disputes over settled card not present transactions.

Are fraud prevention fees on my merchant statement legitimate?

Some are, and some are products you were enrolled in rather than products you chose. Credit card processing is not a regulated industry, and a fee’s name on a statement is chosen by the party billing it. The test is whether the charge touches transactions you actually run and whether you can show when you agreed to it. Our statement decoder covers the individual line items.

Why do published credit card fraud statistics disagree so much?

Three reasons, and they account for most of it. Reports are confused with losses. All fraud is confused with card fraud. And old projections are repeated as current facts long after the publisher has revised them. Always ask which primary source a figure came from and which year it describes.

Paying for fraud tools you never agreed to?

Send us a recent statement. The first audit is free, we charge a flat monthly fee that is never a percentage of what we find, and we take nothing from any processor in any scenario.

Get My Free Audit

or call 800-672-1292

Written by Robert Day, Founder and CEO of weAudit.com, who spent over a decade as an executive at Fifth Third Processing Solutions, later Vantiv and Worldpay, now part of Global Payments, the world’s largest card processor. See also our interchange category study, our guide to credit card processing fees, and what a processing audit costs.

Read More

Check out our other insights here

Interchange Category Study: Visa and Mastercard Rate Categories, 1991 to 2026
A Visa card and a Mastercard card resting on a fanned stack of US banknotes

In 2009 the US Government Accountability Office counted the interchange rate categories Visa and Mastercard used to price credit card transactions. It found 303. Nobody has updated that count since. We did.

View

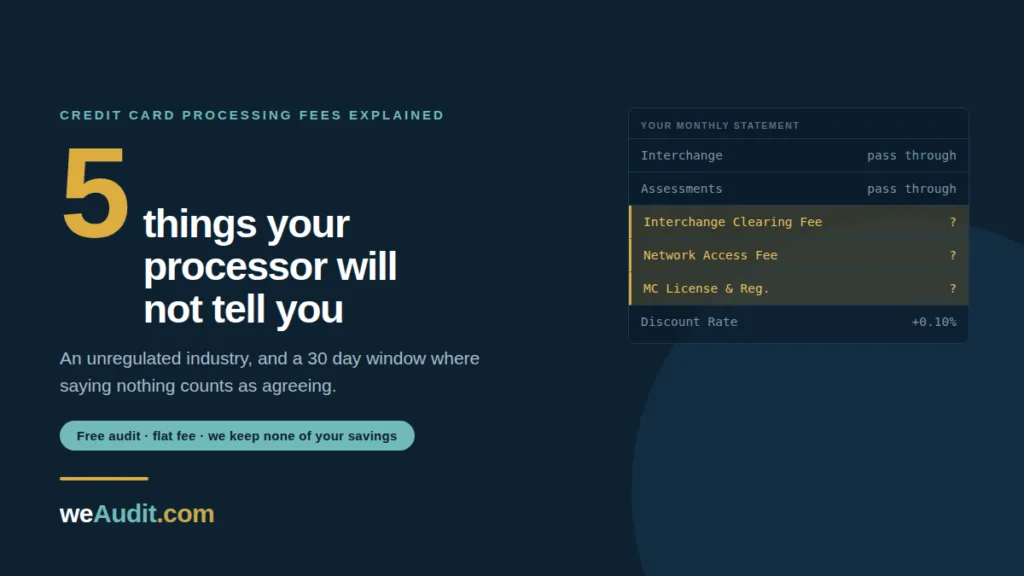
Credit Card Processing Fees Explained: 5 Things Your Processor Will Not Tell You

Credit Card Fees Explained

Most merchants have credit card processing fees explained to them exactly once: on the day they sign. After that, the bill changes on its own. Rates drift, new line items appear with official sounding names, and the one page that would explain it never arrives.

View

Want to talk?

As seen on